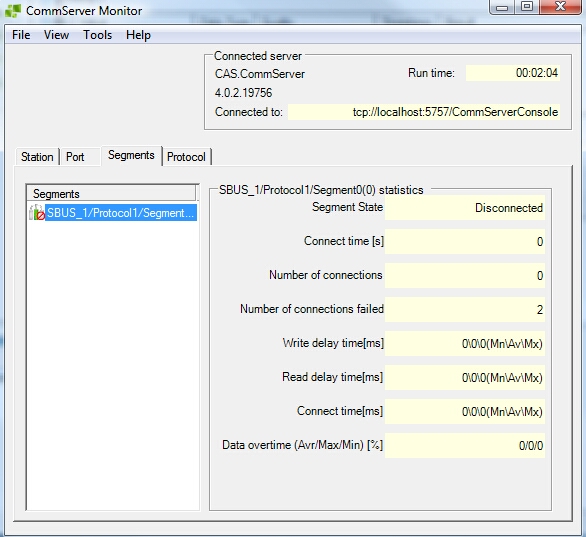
SegmentsTab |
On this tab, you can find information about segments defined previously.

A tick next to the segment name indicates that this segment is in an active state. You can select any segment to view all statistics corresponding to that segment. You can monitor:
Segment state - state of the segment: connected, waiting for connect, inactive
Connect time [s] – whole time in seconds CommServer was connected to that segment
Number of connections – number of successful established connections to that server
Number of connection failed – number of connection failed trials due to segment does not respond
Write delay time [ms] – minimum, maximum and average delays in writing data. Time is measured from an incoming need to write any data (waiting to be connected state) to the connected state.
Read delay time [ms] – minimum, maximum and average delays in reading data. Time is measured from an incoming need to read any data (waiting to be connected state) to the connected state.
Connect time [ms] – Minimal / average / maximal time of the connection (in miliseconds).
Data Overtime [%] – this value indicates an overload level in the selected segment (the value is in percent;e.g. in this figure value 576 means, that process variable scan time is approximately 5 times longer than that set in the configuration). Read more about Data Overtime.
An analysis of this information is the best way to master your configuration skills. |