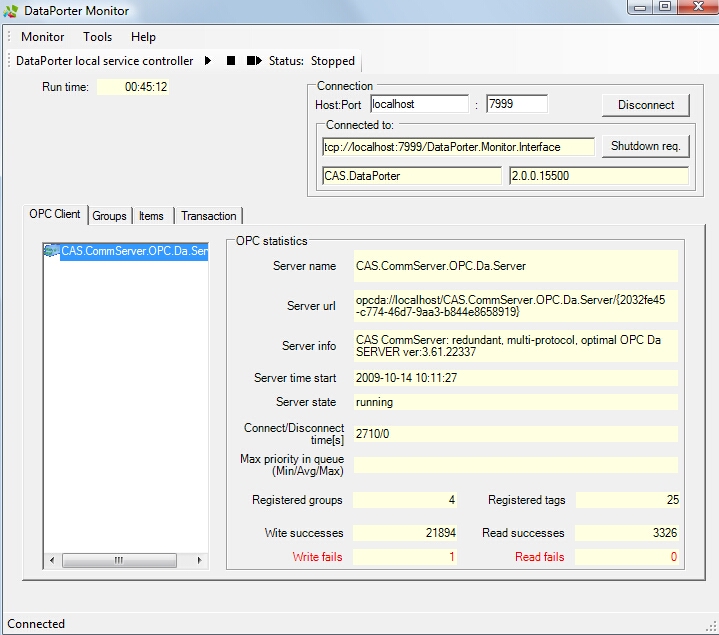
OPC Client tab |
This tab shows configured OPC Servers and their statuses. A server list is on the left side of the window. On the right side there are details about the selected server. Note that icons on the server list can change. By interpreting colors you can easily diagnose the connection with the server: green means everything is ok, red indicates that there are some problems with connection to that server.

On the statistics panel (OPC statistics) you can find the following information about the selected server:
Server name – name of the server (with description and/or vendor name, details depend on the server)
Server url – OPC server address (syntax is the same as in the configuration: opcda://ip_address/server_prog_id)
Server info – additional information about the server (only if the server publishes such data)
Server time start – time that informs when the server has started
Server state – available states: running (everything seems to be ok), not connected (client is unable to connect to the server)
Connect/Disconnect time[s] – time in seconds that informs how long DataPorter is connected to the server and how long it is disconnected
Registered groups – quantity of groups (subscription) that client has created on this server
Registered tags - quantity of tags (items) that client has created on this server
Write successes – quantity of successful write operations
Write fails – quantity of unsuccessful write operations
Read successes– quantity of successful read operations
 Note
NoteIf client can connect to server and is able to read data, this value should be incremented
Read fails – quantity of unsuccessful read operations