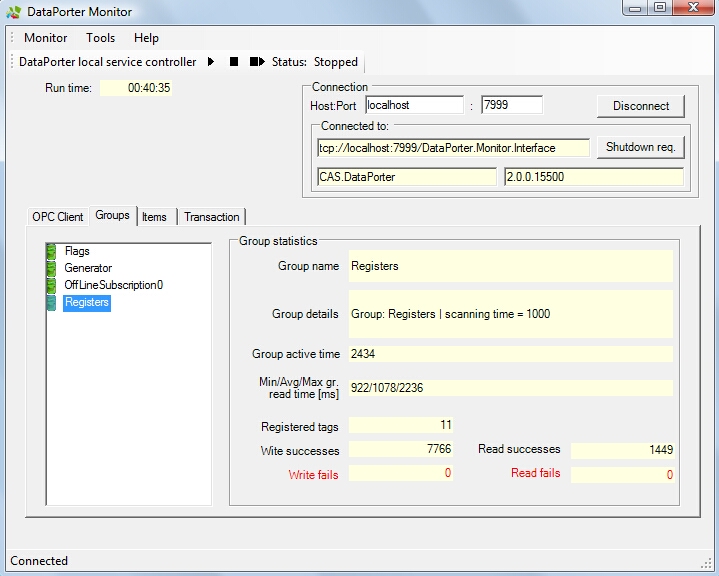
Groups Tab |
This tab presents information about groups (subscription) that are configured. The tab is split into two sections. On the left side there is a list of configured groups. Select one of the groups to show statistics for this group on the statistics panel (Group statistics).

Find the following information on the statistics panel (Group statistics):
Group name – name of the group (subscription) from the configuration
Group details – additional information about the group (subscription), e.g. scanning time
Group active time – time (in seconds) that informs how long the group is in an active stat
Min/Avg/Max transaction scan rate – measured time (in ms) of executing transaction in this group (it can be different from time from the configuration). DataPorter shows minimal (Min), average (Avg) and maximal (Max) time
Min/Avg/Max gr. read time [ms] – measured time of reading this group (it can be different from time from the configuration). DataPorter shows minimal (Min), average (Avg) and maximal (Max) time
Registered transactions – quantity of transactions that belong to the group
Registered tags – quantity of items that are registered in this subscription by OPC Client
Write successes – quantity of successful write operations for this group
Write fails – quantity of unsuccessful write operations for this group
Read successes – quantity of successful read operations for this group
 Note
NoteIf client can connect to the server and is able to read data, this value should be incremented
Read fails – quantity of unsuccessful read operations for this group